


 1 / 72

For the year ended 31 March
2016
2015
Change
Operating results (US$ million)
Revenue
1,856.5
1,879.8
-1.2%
Gross profit
583.3
610.5
-4.5%
Operating profit
202.3
220.1
-8.1%
Profit before taxation
203.1
221.7
-8.4%
Profit attributable to shareholders of the Company
181.4
198.1
-8.4%
Financial position (US$ million)
Cash generated from operations
242.8
250.4
-3.0%
Deposits and cash
273.0
294.2
-7.2%
Shareholders’ funds
525.0
540.8
-2.9%
Per share data (US cents)
Earnings per share – basic
72.2
78.9
-8.5%
Earnings per share – diluted
72.2
78.9
-8.5%
Dividend per share – interim and final
42.0
78.0
-46.2%
Other data (US$ million)
Capital expenditure
38.3
30.9
23.9%
R&D expenditure
56.3
56.1
0.4%
Key ratios (%)
Gross profit margin
31.4
32.5
-1.1% pts
Operating profit margin
10.9
11.7
-0.8% pts
Net profit margin
*
9.8
10.5
-0.7% pts
EBITDA/Revenue
12.8
13.4
-0.6% pts
Return on shareholders’ funds
34.6
36.6
-2.0% pts
* Net profit margin is calculated as profit attributable to shareholders of the Company as a percentage of revenue
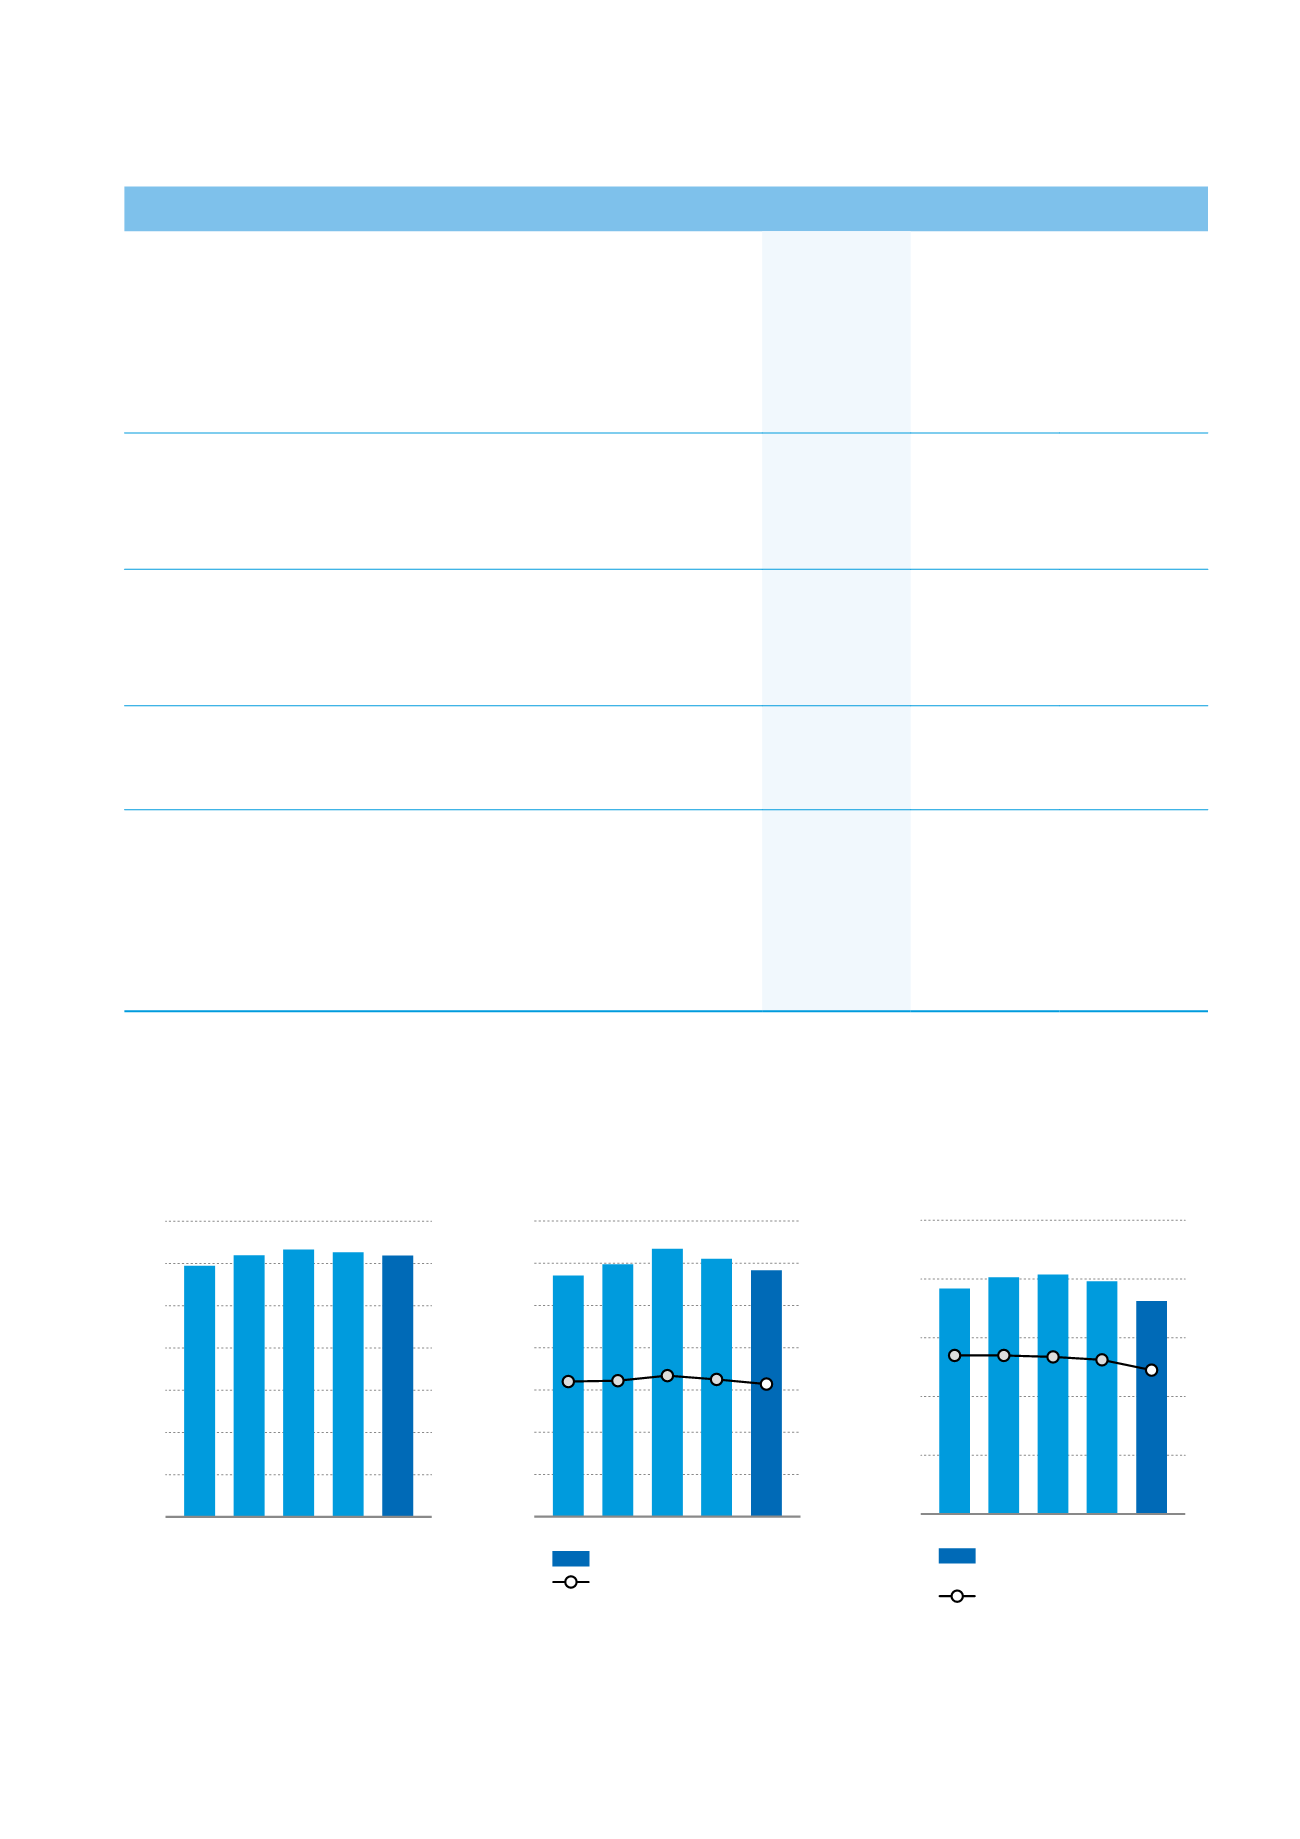
Profit Attributable to Shareholders
of the Company and Net Profit
Margin in Last 5 Years
US$ million
Profit attributable to shareholders
of the Company (US$ million)
Net profit margin (%)
250
200
150
100
50
0
12 13 14 15 16
191.9 201.5 203.8
181.4
198.1
20
16
12
8
4
0
%
10.8 10.8 10.7 10.5
9.8
Gross Profit and Gross Profit Margin
in Last 5 Years
US$ million
Gross profit (US$ million)
Gross profit margin (%)
700
600
500
400
300
200
100
0
12 13 14 15 16
570.8 597.8
634.3
583.3
610.5
70
60
50
40
30
20
10
0
%
32.0 32.2 33.4 32.5 31.4
Group Revenue in Last 5 Years
US$ million
2,100
1,800
1,500
1,200
900
600
300
0
12 13 14 15 16
1,784.5
1,858.0 1,898.9
1,856.5
1,879.8
1
VTech Holdings Limited
Annual Report 2016
Financial Highlights