


 3 / 56

Sustainability Report 2016
3
About
VTech is the global leader in electronic
learning toys from infancy through
toddler and preschool
2
and the world’s
largest manufacturer of cordless
telephones. It also provides highly
sought-after contract manufacturing
services. Our product lines include
electronic learning products (ELPs),
telecommunication (TEL) products, and
contract manufacturing services (CMS).
With headquarters in the Hong
Kong Special Administrative Region
and state-of-the-art manufacturing
facilities in China, VTech currently
has operations in 11 countries and
regions. In FY2016, VTech has 27,400
employees in average, including around
1,400 research and development
(R&D) professionals in R&D centres in
Canada, Germany, Hong Kong and
China. This network allows VTech to
stay abreast of the latest technology
and market trends throughout the
world, while maintaining a highly
competitive cost structure.
The Group invests significantly in R&D
and launches numerous new products
each year. VTech sells its products via a
strong brand platform supported by an
extensive global distribution network of
leading traditional and online retailers.
VTech’s customer profile consists of
commercial buyers in our three product
lines and direct consumer purchasers
through our e-commerce business.
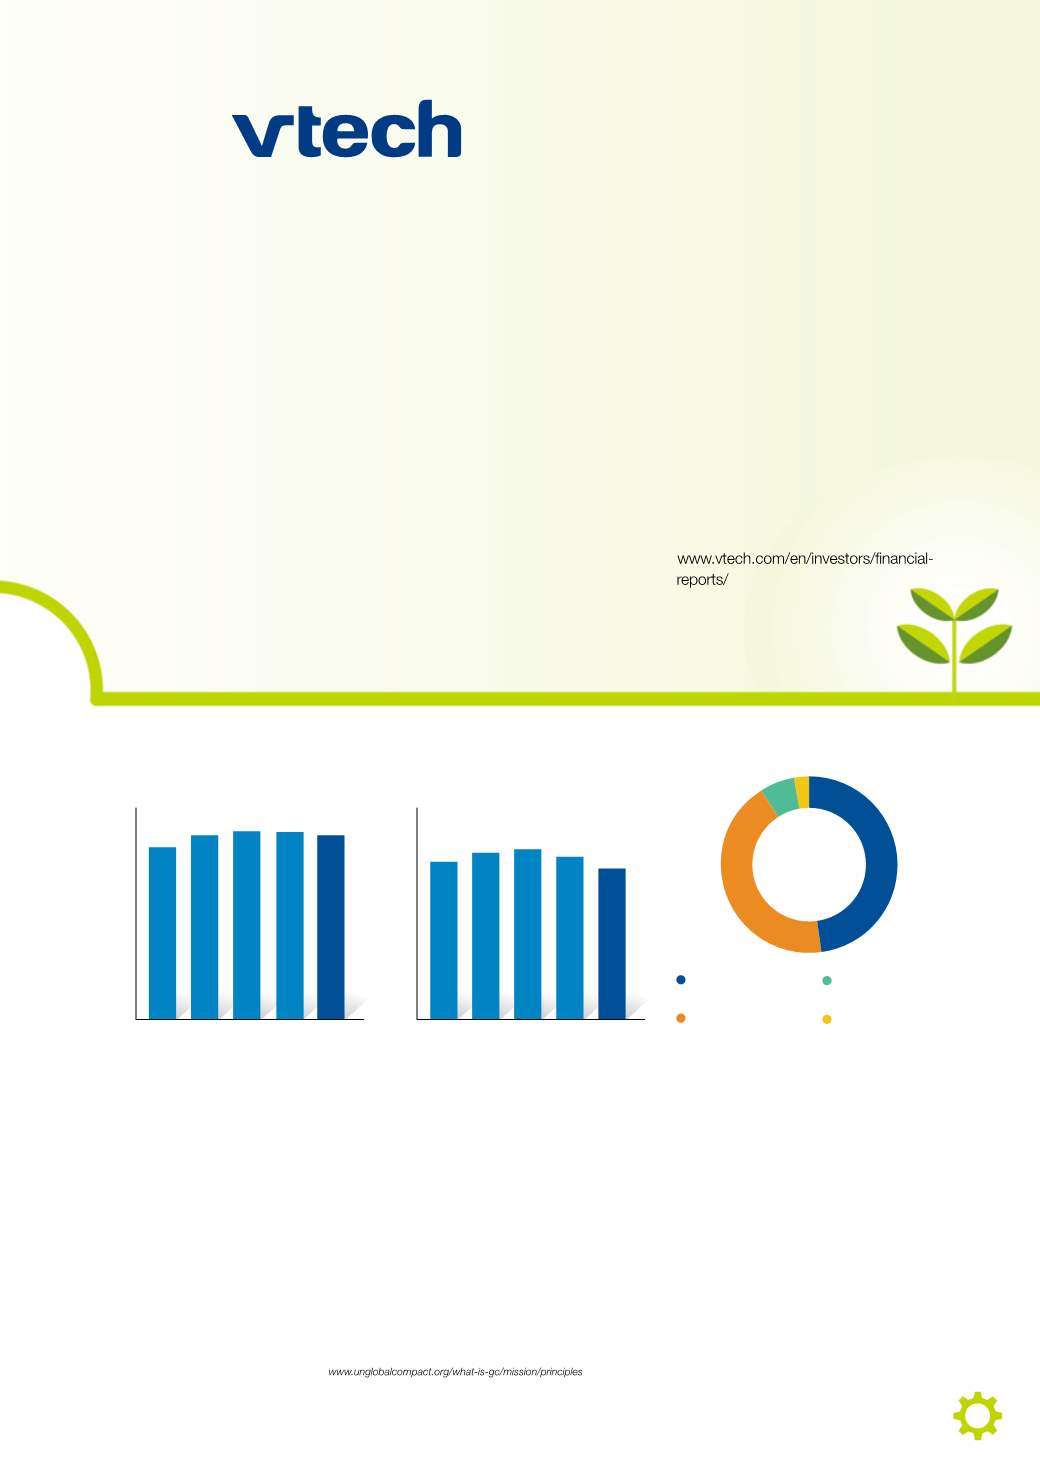
For the year ended 31 March 2016,
Group revenue and profit attributable
to shareholders of the Company were
US$1,856.5 million and US$181.4
million respectively. At 31 March 2016,
the Group had working capital and
total assets of US$169.7 million and
US$910.5 million respectively. The
Group’s total equity was US$525.0
million and had no borrowings as at 31
March 2016.
Shares of VTech Holdings Limited are
listed on The Stock Exchange (HKSE:
303). At 31 March 2016, the number
of issued and fully paid shares of the
Company was 251,182,133 shares.
For details of our financial performance,
please refer to the financial highlights
included in our Annual Report 2016 at:
At VTech, we manage our business
in accordance with a number of key
external charters. We adhere to and
implement policies that are coherent
with 10 UN Global Compact principles
3
,
which itself is built upon many
internationally agreed principles relating
to welfare of workers, environmental
management and anti-corruption.
Since 2012, we have subscribed to the
Electronic Industry Citizenship Coalition
(EICC) Code of Conduct and the
International Council of Toy Industries
(ICTI) Code of Business Practices,
which are specific to our industries.
To keep abreast with the latest trends
and development within our industry,
we have participated in a number of
trade associations around the world.
We primarily engage as members, but
where possible we will collaborate on
industry projects to help develop the
markets and industry standards. Many
of our memberships require us to meet
a Code of Conduct which provides
VTech stakeholders with further peace
of mind and confidence.
2 Source: NPD Group, Retail Tracking Service and Global Market Share Estimates by MarketWise Consumer Insights, LLC. Ranking based on total retail
sales in the combined toy categories of Toddler Electronic Learning, Toddler Figures, Playsets and Accessories, Preschool Electronic Learning, Electronic
Entertainment excluding Tablets and Walkers for the 12 months ending December 2015
3 The UN Global Compact asks companies to abide by its 10 principles, protecting the core values of the UN’s human rights, labour standards,
environmental and anti-corruption policies. See
for more details
Group Revenue in Last 5 Years
Revenue by Regions
for the year ended 31 March 2016
Profit Attributable to Shareholders
of the Company in Last 5 Years
North America 47.3%
US$878.3 million
Europe 42.9%
US$795.9 million
Other Regions 2.9%
US$53.3 million
Asia Pacific 6.9%
US$129.0 million
2,100
1,800
1,500
1,200
900
600
300
0
250
200
150
100
50
0
FY2012
FY2012
FY2013
FY2013
FY2014
FY2014
FY2015
FY2015
FY2016
FY2016
1,784.5
191.9
1,858.0
201.5
1,898.9
203.8
1,879.8
198.1
1,856.5
181.4
US$ million
US$ million
Total:
US$1,856.5
million