


 45 / 54

Sustainability Report 2017
45
Note:
1. Energy value for fuels are obtained from GRI G3 Guide
2. Water consumption data includes water usage data and staff count from 3 manufacturing facilities in China and 13 offices in China and overseas
3. GHG Conversion factors are obtained from WRI
(http://www.wri.org/publication/getting-every-ton-emissions-right)and cover CO
2
, CH
4
and N
2
O Greenhouse gases
4. Injury – number of cases. Injury types accounted for include: Vehicle Accident, Falling Object Injury, Machines Entanglement, Cutting Injury, Falling from heights, Collapse Injury, Burnt
injury, Chemical injury, Collision injury, Electric shock
5. Lost Hours – total working hours that workers cannot attend work due to injuries in manufacturing operations
6. Injury rate per employee – The frequency of injuries relative to the number of employees
7. Absentee rate – days employees away from work over total hours scheduled to be worked
8. Management staff – staff with grade above supervisor level
9. Local Community – the location of operation sites
10. VTech started collect relevant data from FY2015
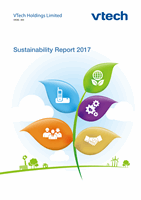
Items
G4 Indicator HKEx Indicator
FY2014
FY2015
FY2016
FY2017
Average training hours per employee – staff &
workers
G4-LA9
B3.2
21.2
24.9
31.8
45.6
Incidents of non-compliance with regulations on
health and safety impact on products that result in
a significant fine, penalty or warning
G4-PR2
0
0
0
0
Incidents of non-compliance with regulations on
product and service information and labelling that
result in a significant fine, penalty or warning
G4-PR4
0
0
0
0
Sales of banned products
G4-PR6
0
0
0
0
Significant fines for non-compliance with
regulations concerning the provision and use of
products and services
G4-PR9
0
0
0
0
Total hazardous waste produced (in tonnes)
A1.3
N/A
10
399.9
326.4
320.9
Total hazardous waste produced per production
output (in tonnes per 1,000 unit)
A1.3
N/A
10
0.003
0.003
0.002
Total non-hazardous waste produced (in tonnes)
A1.4
N/A
10
9,771.8
8,738.0
9,507.0
Total non-hazardous waste produced per
production output (in tonnes per 1,000 unit)
A1.4
N/A
10
0.073
0.066
0.066
Total Packaging material used for finished goods
(tonnes)
A2.5
N/A
10
29,593.0
30,510.3
34,579.8
Total Packaging material used for finished goods
per production output (in tonnes per 1,000 unit)
A2.5
N/A
10
0.221
0.230
0.242
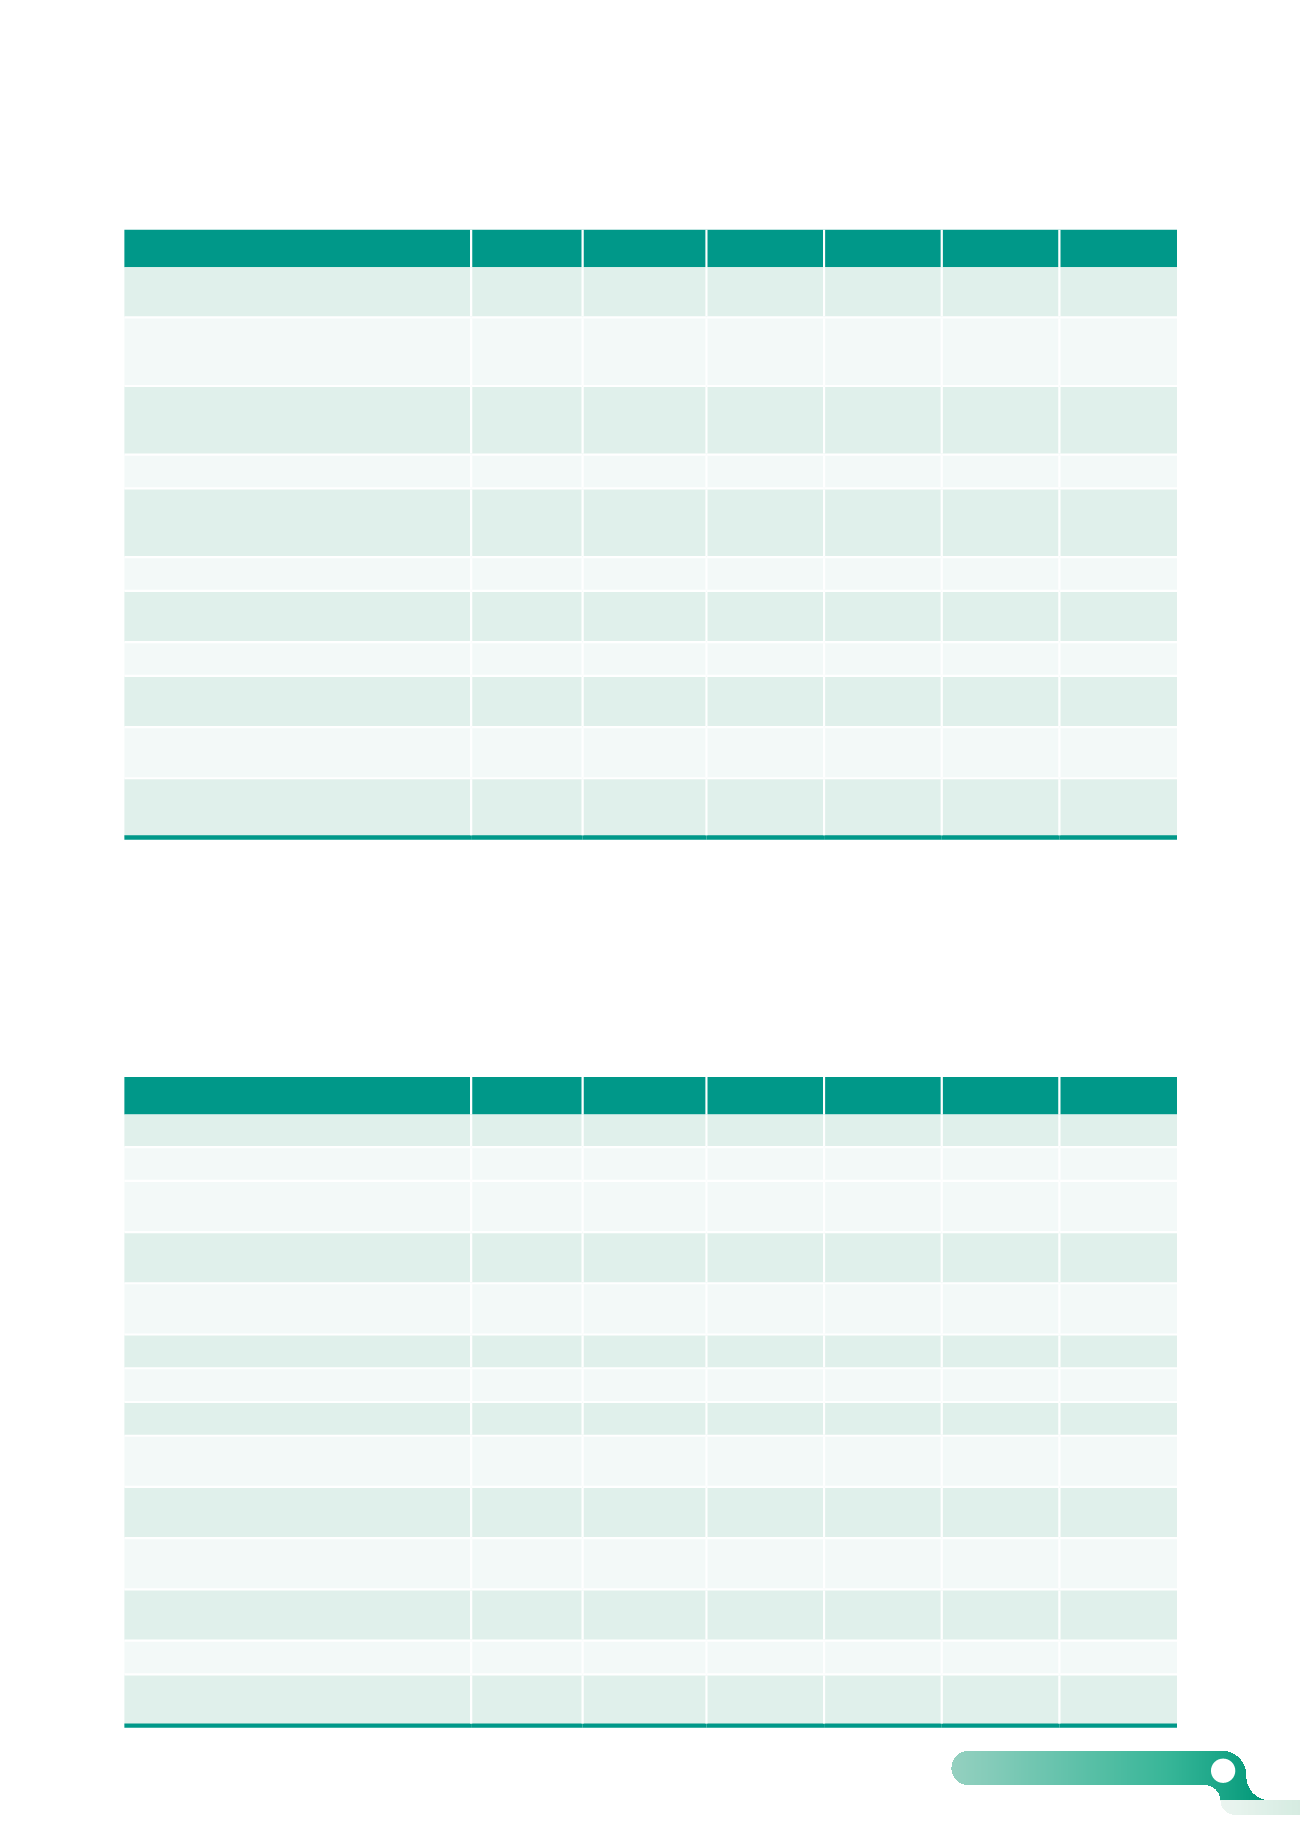
Items
G4 Indicator HKEx Indicator
FY2014
FY2015
FY2016
FY2017
Number of countries where VTech operates
G4-6
11
11
11
13
Total number of operations
G4-9
18
20
20
22
Revenue
G4-9
US$1,898.9
million
US$1,879.8
million
US$1,856.5
million
US$2,079.3
million
Total debt
G4-9
Nil
Nil
Nil
US$1.7
million
Total equity
G4-9
US$562.4
million
US$540.8
million
US$525.0
million
US$584.7
million
Average number of employees – Total
G4-9
B1.1
30,949
29,502
27,412
27,217
Average number of employees – Male
G4-10
B1.1
18,590
18,702
16,583
16,565
Average number of employees – Female
G4-10
B1.1
12,359
10,800
10,829
10,652
Average number of employees – Asia Pacific –
Male
G4-10
B1.1
18,374
18,474
16,352
16,227
Average number of employees – Asia Pacific –
Female
G4-10
B1.1
12,165
10,610
10,630
10,348
Average number of employees – North America
– Male
G4-10
B1.1
133
141
144
206
Average number of employees – North America
– Female
G4-10
B1.1
97
97
104
172
Average number of employees – Europe – Male
G4-10
B1.1
83
87
87
132
Average number of employees – Europe –
Female
G4-10
B1.1
97
93
95
132